
Contribution Graph Standard 1 component design & features
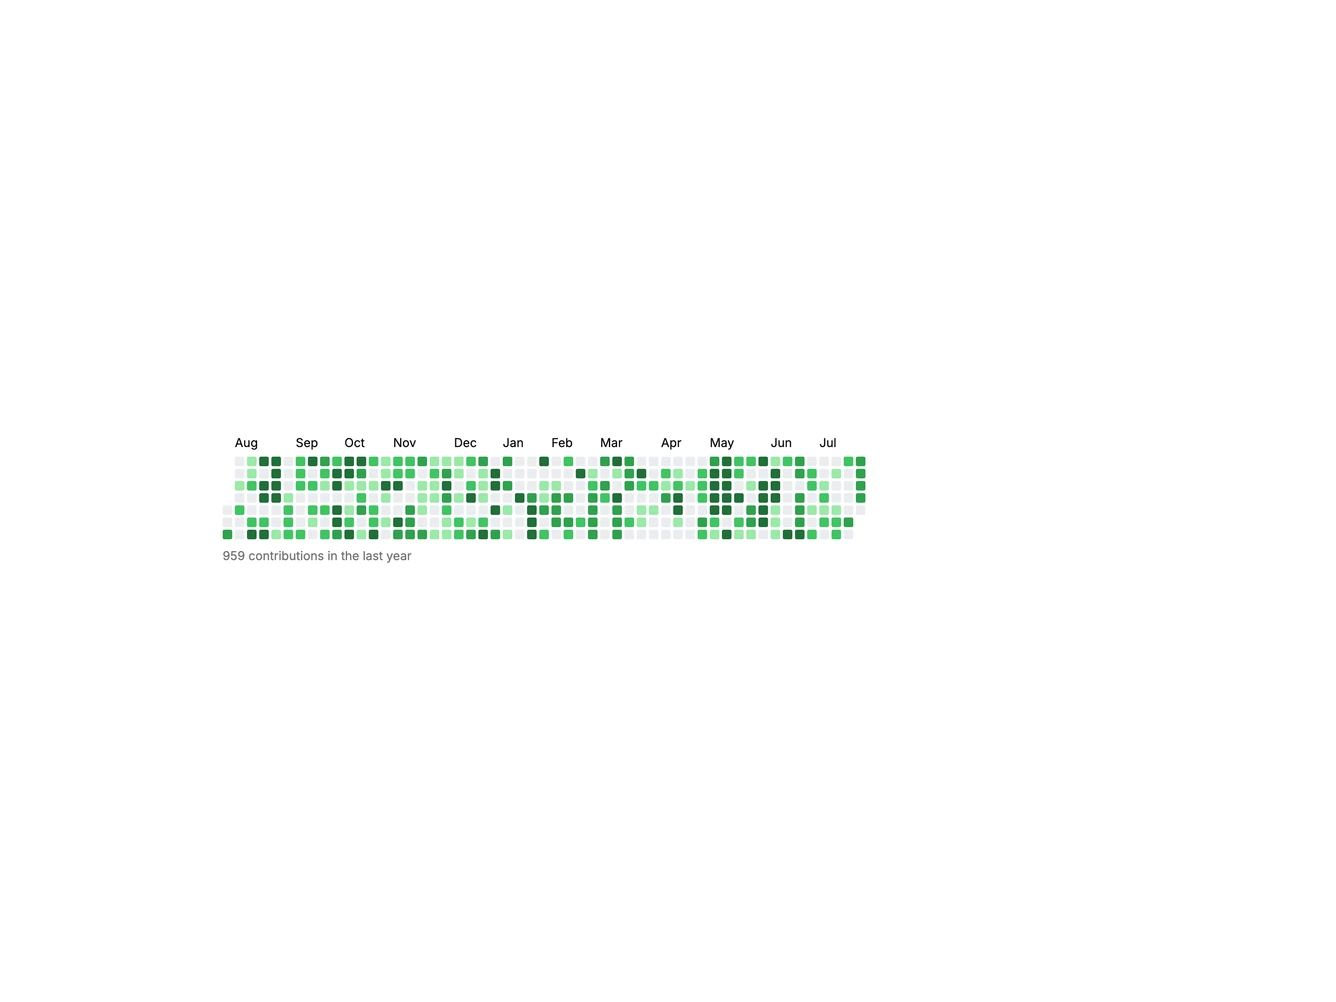
This example renders a Kibo UI ContributionGraph spanning the last 365 days — the familiar GitHub profile heatmap rectangle with month labels and a yearly total.
Contribution graphs are useful for developer profiles, habit trackers, and activity dashboards.