
Chart Revenue Total 1 component design & features
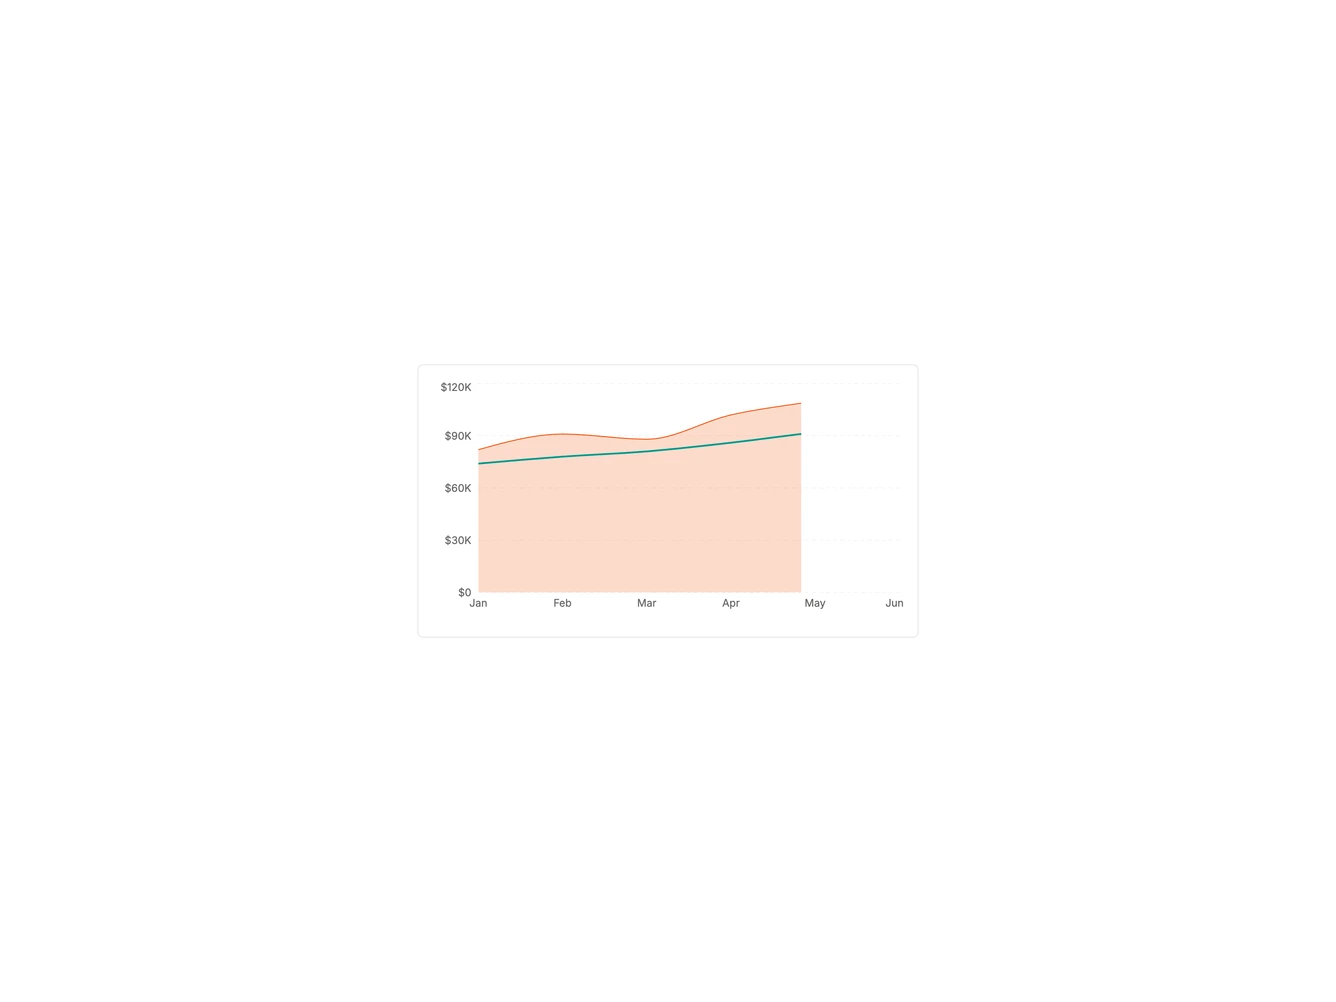
This chart example uses the shadcn ChartContainer with a Recharts composed chart. An area series shows this year revenue while a line series overlays the previous year for a direct comparison across months.
Use it when this period and the previous period should be compared on the same plot.