
Chart Revenue Period 1 component design & features
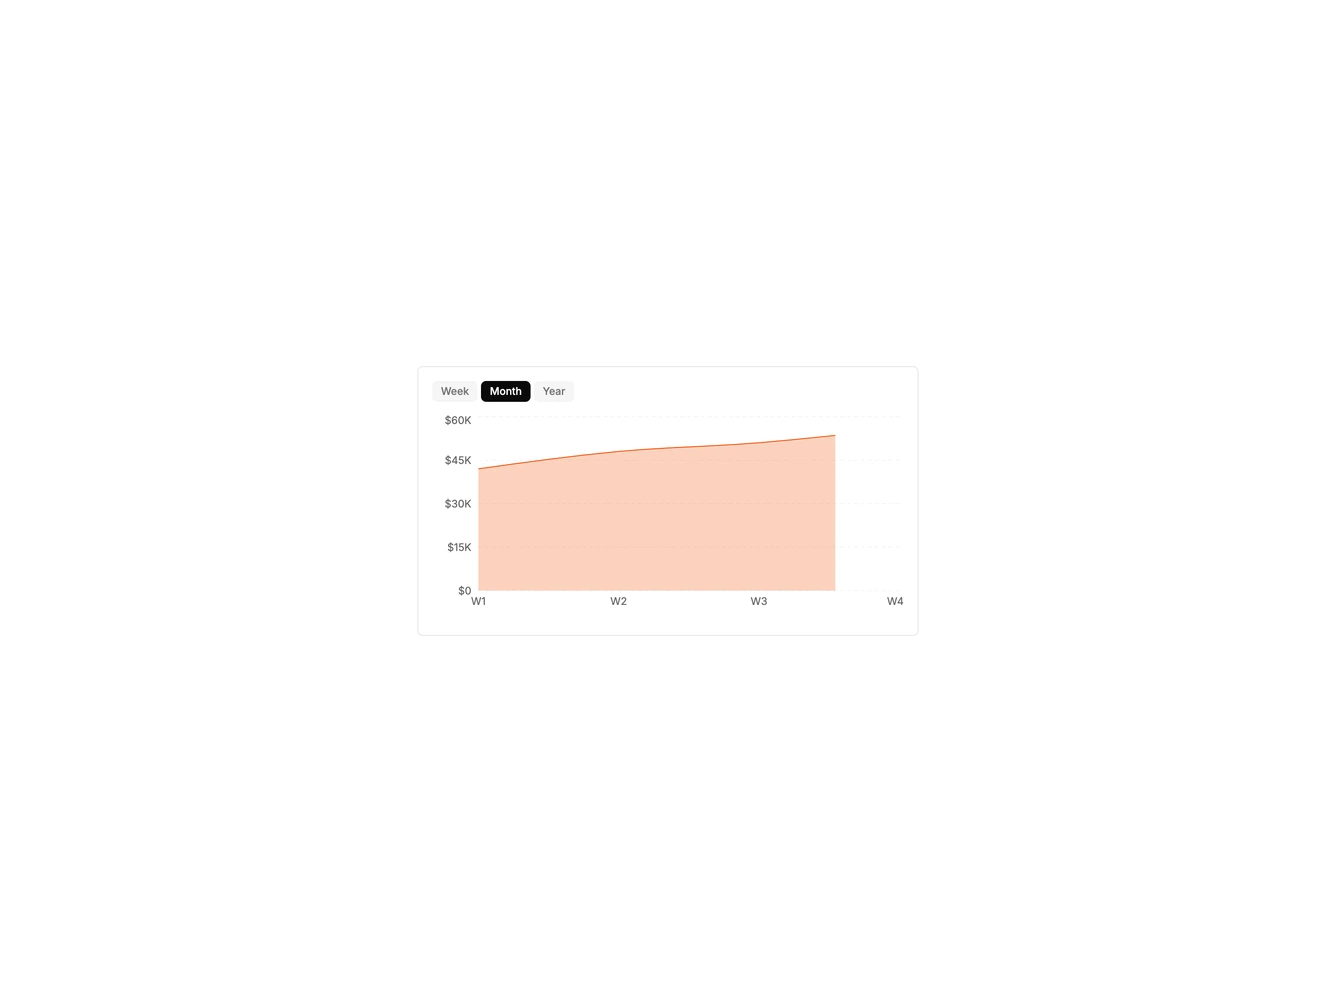
This chart example uses the shadcn ChartContainer with a Recharts area chart and period tabs. Switching the period replaces both the plot data and the summary value above the chart.
Use it when one card should answer a weekly, monthly, or yearly question.