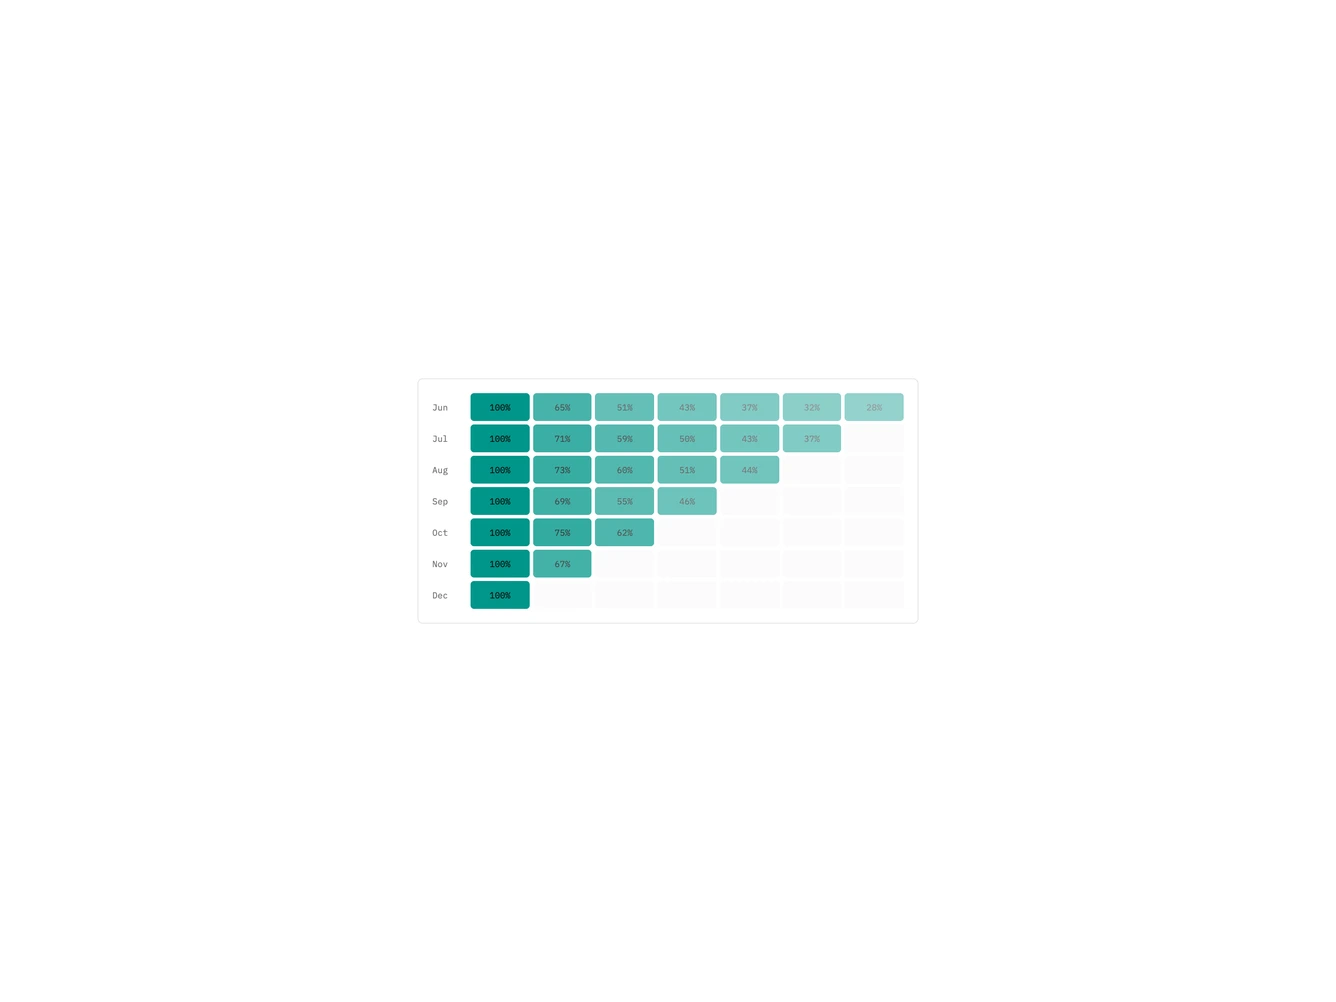
Chart Retention Grid 1 component design & features
This chart example renders a retention cohort grid as nested percentage cells. Each row is a signup month and each column is months since acquisition, with opacity mapped to retention strength.
Use it when each row is a cohort and each column is how much of that cohort remains.