Chart Heatmap Traffic 1 component design & features
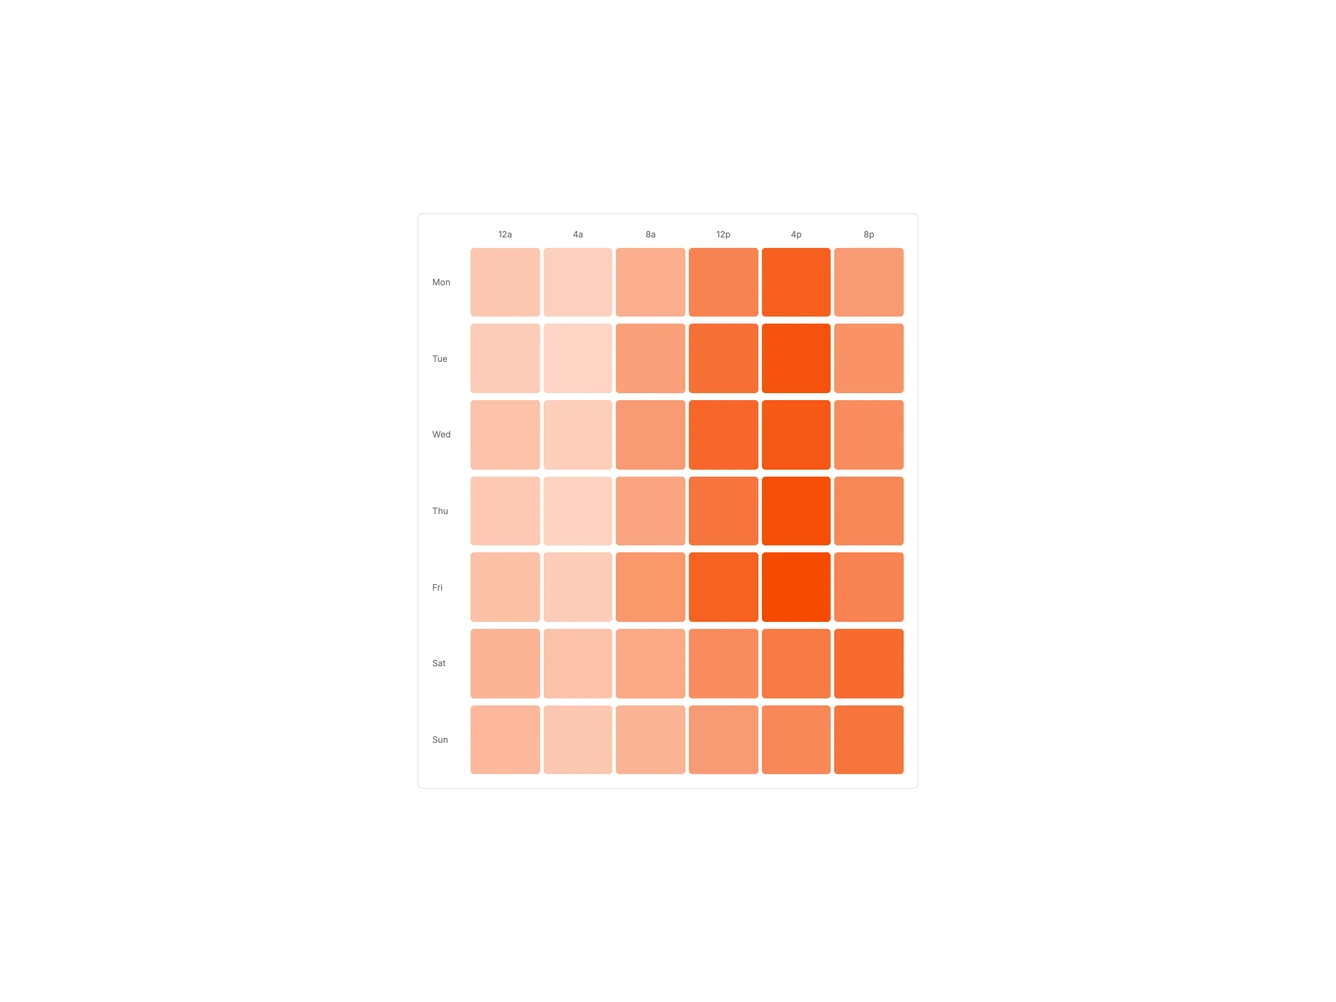
This chart example renders a traffic heatmap as a CSS grid of intensity cells. Each cell maps a weekday and hour bucket to a visit strength value with a tooltip-friendly label.
Use it when timing across a week matters more than a single line.