
Chart Costs Period 1 component design & features
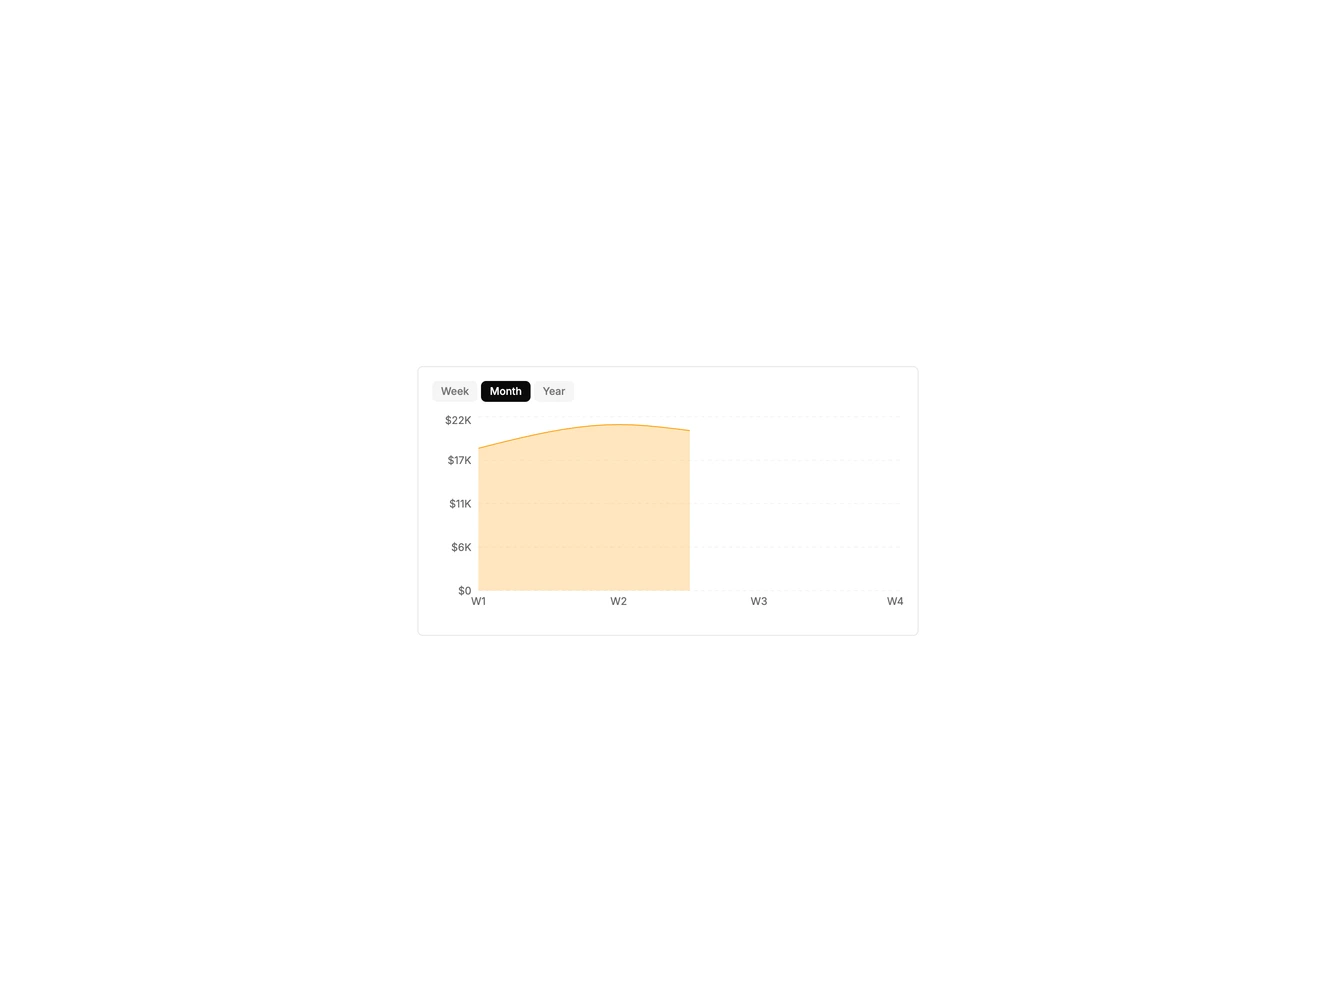
This chart example uses the shadcn ChartContainer with a Recharts area chart focused on costs. Period tabs swap the underlying series so the same card can show weekly burn, monthly spend, or yearly totals.
Use it when the same card should answer a weekly, monthly, or yearly question.