
Chart Area Stacked component design & features
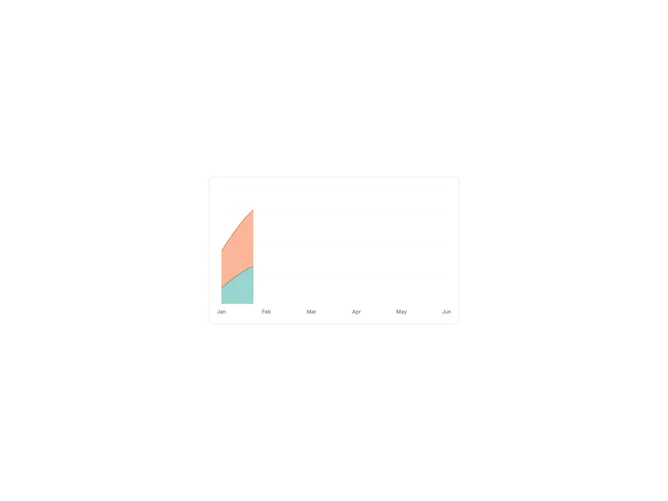
A stacked area chart comparing multiple data series layered on the same axis.
Area charts work well for showing volume or cumulative trends over time, such as revenue growth, traffic patterns, or resource usage in dashboards and analytics pages.