Uptime 6 block design & features
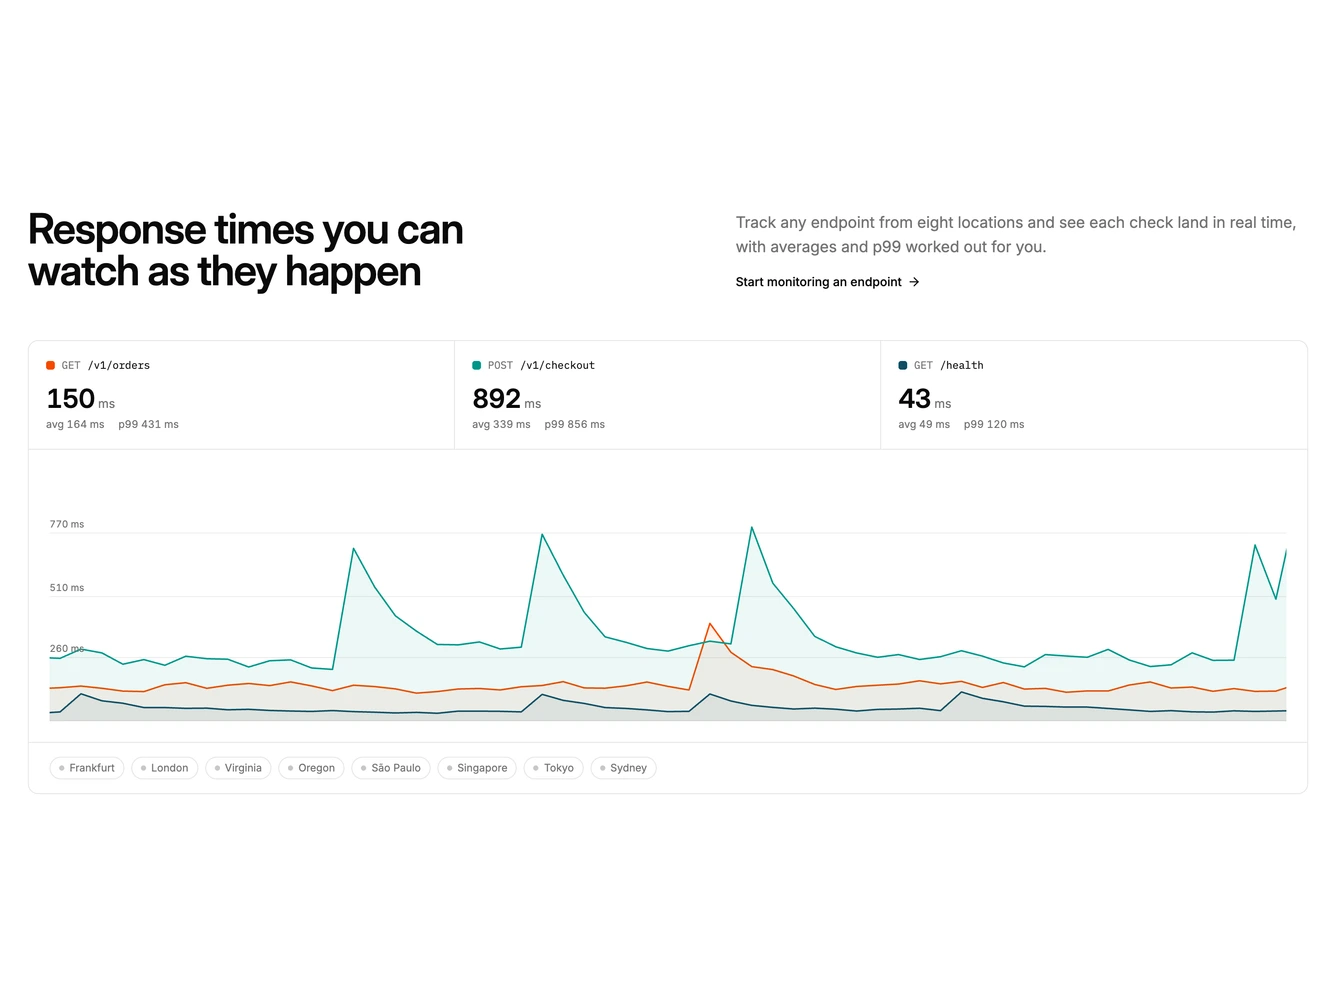
Uptime6 is a response time monitoring section built with shadcn/ui and Tailwind CSS. A heading and description sit above a panel with three endpoint summaries, a live line chart and a row of eight check locations.
The chart scrolls steadily as new readings arrive for each endpoint, with occasional spikes, and the scale eases to fit the visible lines. Each endpoint summary shows the current response time with its average and p99, and doubles as a toggle that fades its line in or out. Hovering the chart pauses it and shows a crosshair with the reading for each endpoint, and the location chips light up one after another as each check runs, keeping their latest time.
The endpoint summaries stack on phones and the chips wrap onto extra rows. Use it for API monitoring, observability and developer tools, and reduced motion shows a still chart.