

Stats 18 block design & features
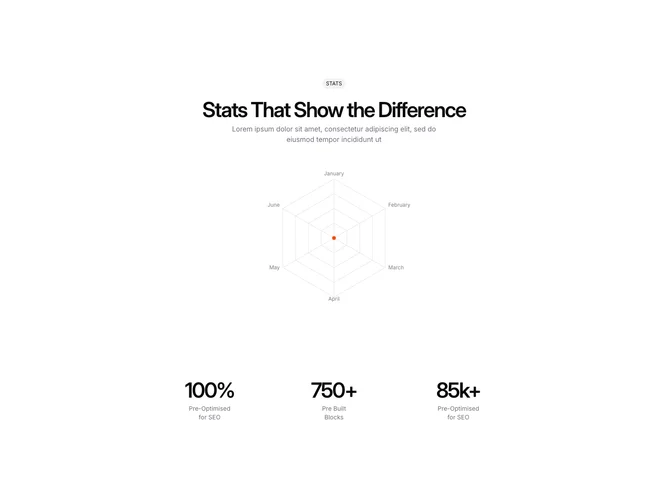
Stats18 is a centered stats section built with shadcn/ui. A muted STATS pill, heading, and short paragraph sit above a radar chart, with three figures in a row underneath. The radar plots monthly desktop values on a polar grid with dots at each vertex and a hover tooltip.
The chart is a filled polygon at partial opacity on a light polar grid, with month labels around the edge. The header type matches the other chart stats blocks: tight-tracking heading, small pill, muted body. Figures below are large with short captions. The stack is open, with the radar taking most of the vertical space.
A radar chart is less common than a line or a number grid, so this feels a bit more analytical and less like a generic proof strip. Complexity is moderate: the chart is code-driven and needs a labeled series, while the three figures are ordinary content swaps.