

Stats 17 block design & features
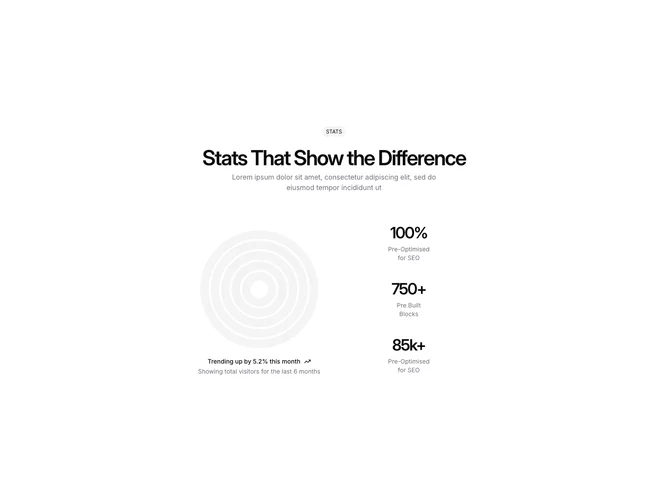
Stats17 is a Shadcn UI stats section with a centered pill, heading, and paragraph, then a two-column body. The left column is a radial bar chart of visitors by browser, with a trending-up line and a six-month visitors caption under it. The right column stacks three figures with short labels.
The radial chart uses a blue scale from pale to deep navy, with concentric rings and a hover tooltip naming each browser. The trend line includes a small up icon. The three figures on the right are large and centered, with muted captions. Spacing is tighter in the two-column body than in the header.
The radial breakdown plus a KPI stack reads more like an analytics snapshot than a landing-page number strip. It is a moderate, mixed-complexity block: the chart is code-driven, and you need browser (or category) series data plus three supporting metrics.
On smaller screens the chart sits above the three figures, which then run in a horizontal row instead of a stack.