
Dashboard 19 block design & features
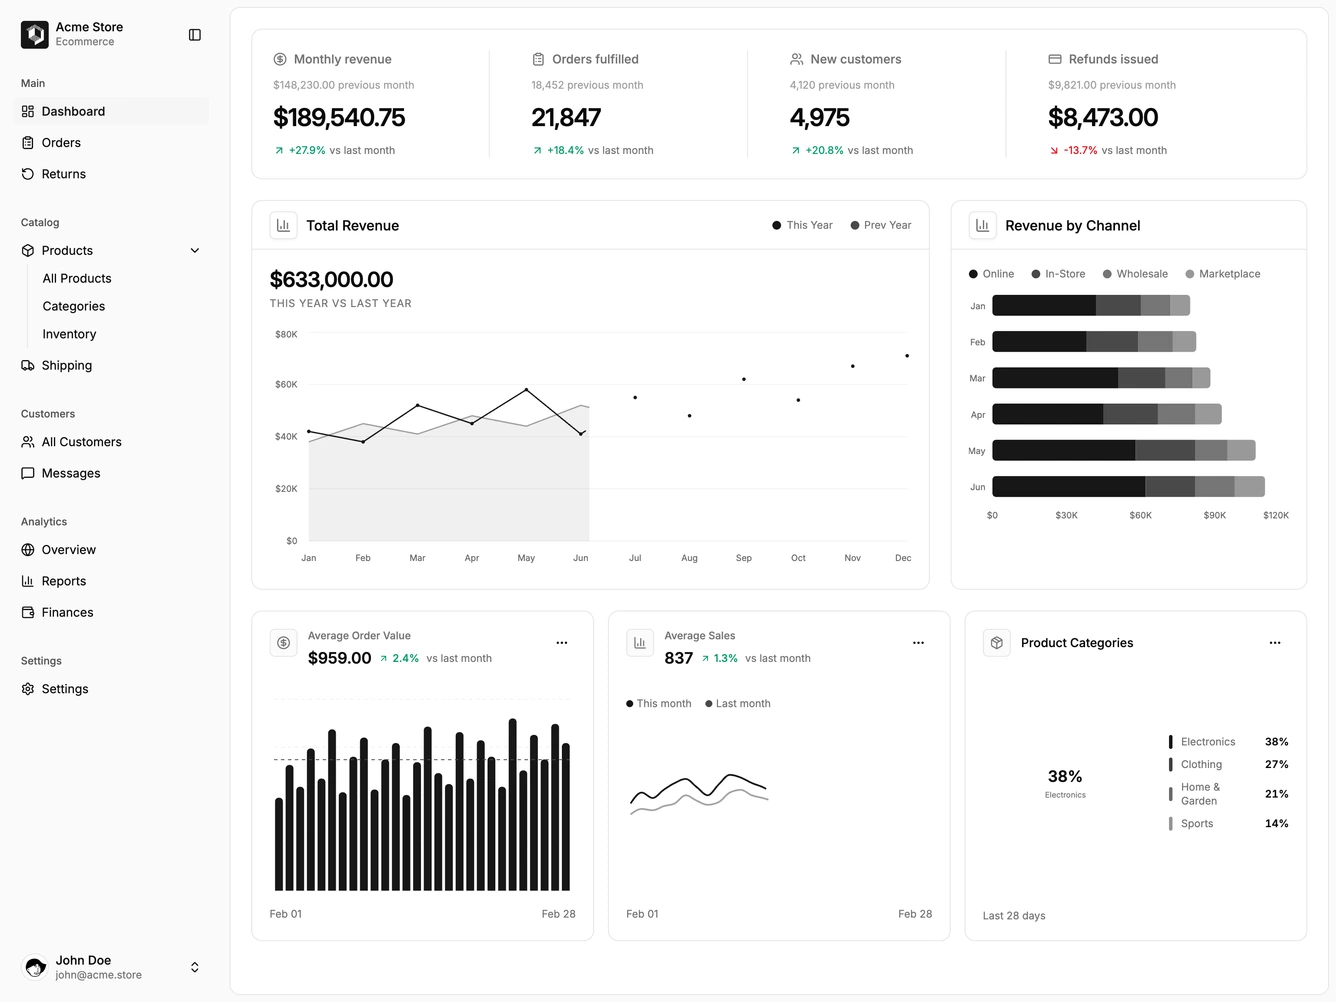
Dashboard19 is a full-width sales dashboard page body built with shadcn/ui, opening with a four-stat KPI row then a split of total revenue and channel revenue charts. Below that, three mini charts cover average order value, average sales, and channel mix. A collapsible Acme Store sidebar frames the page.
Light card surfaces sit on a background canvas with hairline borders and compact spacing. KPI deltas use up and down arrows with tabular numbers. Charts rely on theme chart colors mixed from the primary token. The layout stays dense but readable, with no marketing-scale vertical padding.
This reads as a practical ecommerce overview rather than a marketing dashboard mock. The combination of year comparison and stacked channel bars is the distinctive story. Complexity is moderate and mostly code-driven through Recharts series and inline mock data.
On smaller screens the KPI row wraps to two columns and the chart pair stacks, keeping the mini charts in a single column.