
Dashboard 25 block design & features
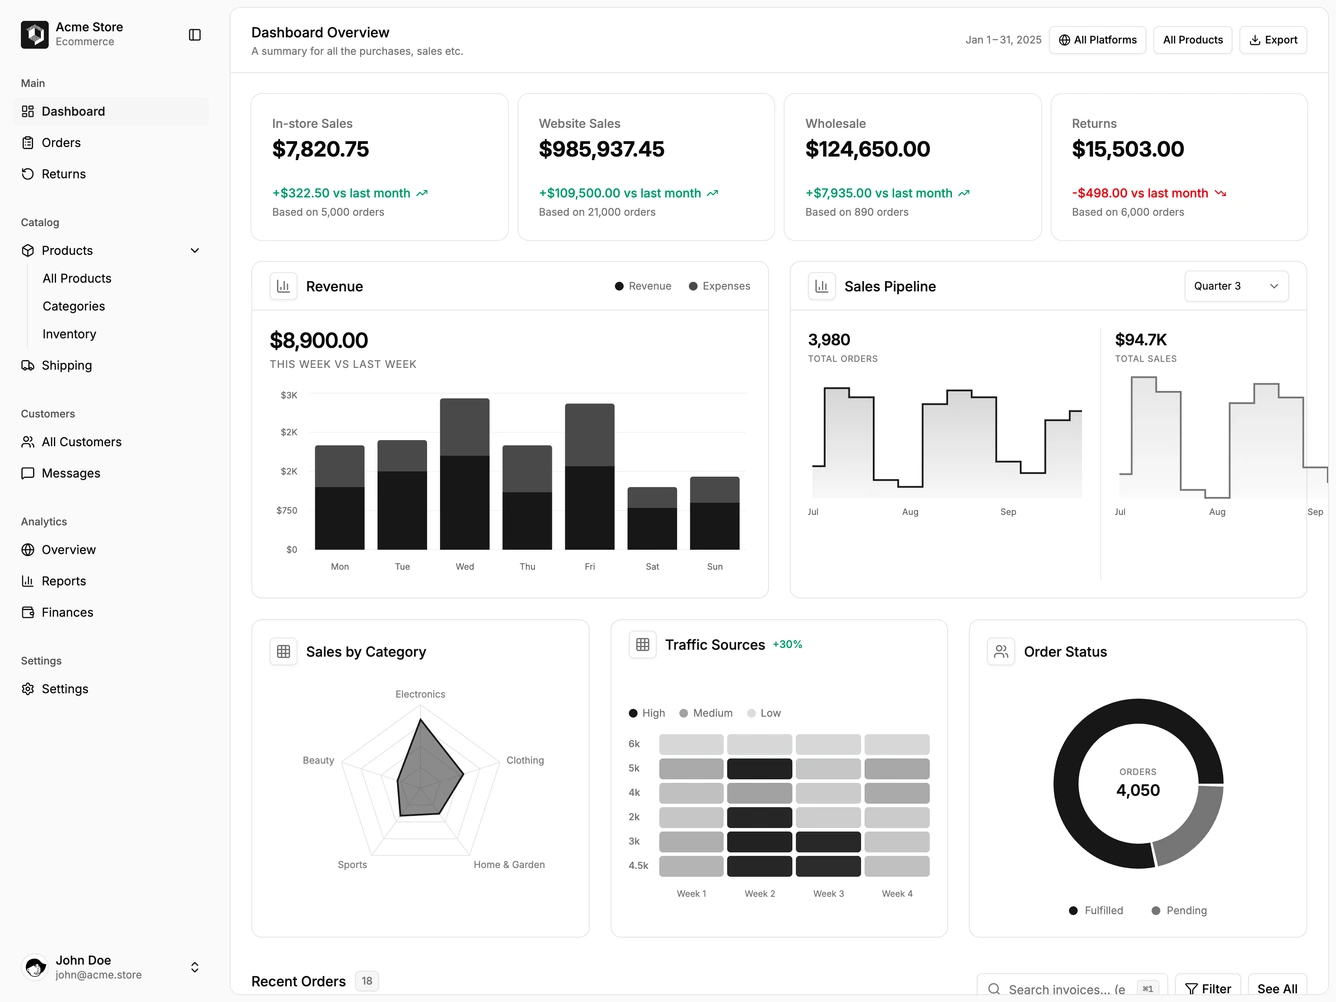
Dashboard25 is an accounting-style sales dashboard built with shadcn/ui. An in-page header introduces rich metric cards, then a searchable invoices table, a sales pipeline chart, income-by-category donut, traffic heatmap, and order status donut.
The layout is elaborate, with layered cards and a denser information hierarchy than the simpler revenue overviews. Invoice status chips and sort controls sit in the table toolbar. The heatmap uses a weekday grid with intensity cells.
This feels serious and ledger-adjacent. Complexity is high and mostly code-driven through multiple chart compositions plus invoice sorting and filtering.
Desktop uses multi-column chart rows; mobile stacks the analytics cards under the invoice table.