Dashboard 1 block design & features
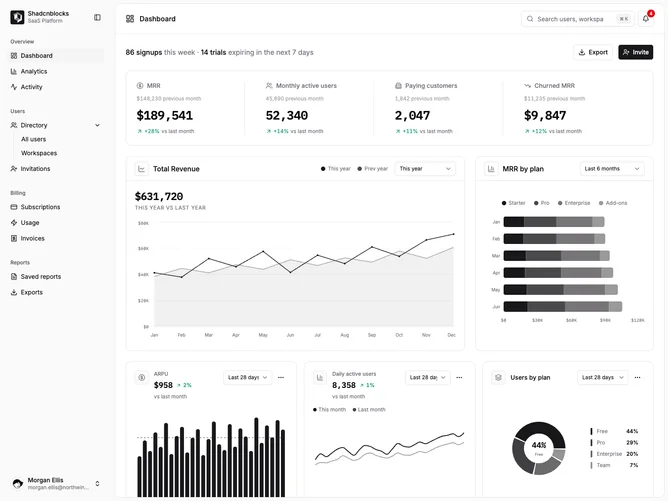
Dashboard1 is a generic SaaS-style revenue and users dashboard built with shadcn/ui: collapsible sidebar (overview, user directory, billing, reports), header with search tuned for users and workspaces, a short summary line for signups and trial reminders, and four KPIs (MRR, monthly active users, paying customers, churned MRR). The main charts include year-over-year revenue, stacked MRR by subscription plan, a trailing ARPU bar series with an average reference line, a DAU line comparison against the prior period, and a donut showing user share by plan tier.
Charts use a monochromatic palette from the primary color. Stat cards show month-over-month deltas with semantic coloring.
To wire it to real data, provide MRR time series, plan-level MRR breakdowns, user counts by plan, ARPU samples, DAU series, and standard subscription billing exports.