Chart Group 9 block design & features
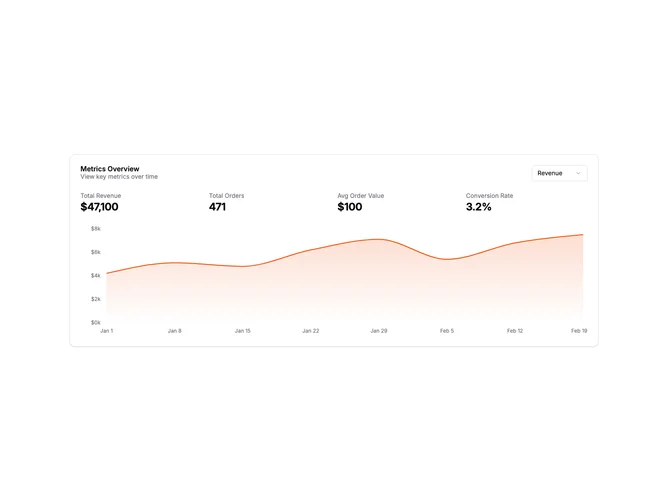
ChartGroup9 is a simple card with a dropdown selector to switch between three chart views. The header includes a metric selector dropdown. Below the header is a four-column stats row. The chart area switches between area, bar, and line visualizations based on the selected metric.
Light card surface with the dropdown aligned right in the header. The stats row shows key totals in a responsive grid. Each metric uses a different chart type - area chart for revenue, bar chart for orders, and line chart for visitors - using visualizations appropriate to each data type.
This card demonstrates a switchable chart pattern. The metric selector lets users focus on different data without navigating away. Summary stats provide context before examining the chart. A clean pattern for presenting multiple related metrics in a compact space.
The stats grid is responsive, collapsing from four to two columns on smaller screens. The chart maintains full width at all breakpoints.