Chart Group 7 block design & features
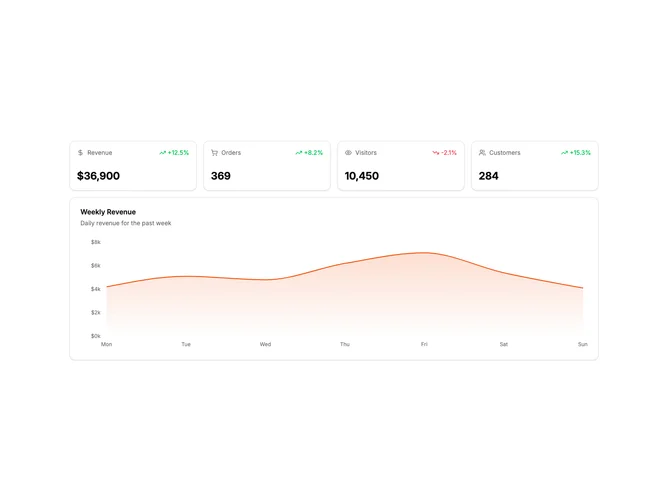
ChartGroup7 is a section with a row of four stat cards above a full-width chart. The stat cards show key metrics with icons and trend indicators. The chart below shows the primary metric over time, providing visual context for the numbers above.
Light card surfaces with stat cards showing a value, trend indicator with percentage, and comparison period. The chart uses a gradient fill area chart. Vertical spacing separates the stats row from the chart. The layout creates a complete overview in one section.
This is a classic pattern combining summary stats with a trend visualization. Users see the key numbers first, then can examine the trend below. The four-stat row covers the most important metrics while the chart provides depth on one of them. A self-contained section that works standalone or combined with other blocks.
The stats grid is responsive, going from four columns on desktop to two on tablet and one on mobile. The chart remains full-width at all breakpoints.