Chart Group 6 block design & features
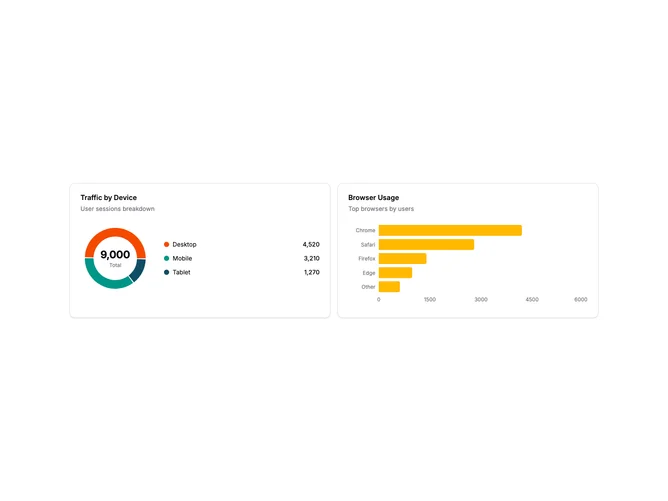
ChartGroup6 is a two-column layout pairing a donut chart with a horizontal bar chart. The left card shows device breakdown with a donut and legend. The right card shows browser usage as horizontal bars. Both visualizations show categorical breakdowns of traffic data.
Light card surfaces with the donut using distinct chart colors for each segment. The center displays the total count. The legend sits beside the donut with colored indicators. The bar chart uses a single color for all bars with category labels on the left. Both cards have matching heights.
This pairing is common for analytics dashboards showing related categorical breakdowns. The donut shows proportional distribution while the bar chart shows ranked values. Using different chart types prevents visual monotony while keeping the data theme consistent. Useful for traffic analysis, user segmentation, or any multi-dimensional categorical data.
The layout stacks on mobile with the donut chart card on top. Both charts scale proportionally within their containers.