Chart Group 5 block design & features
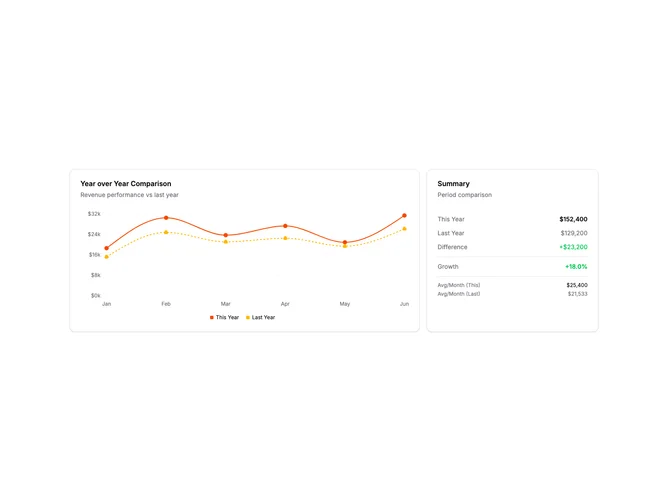
ChartGroup5 is a comparison layout with a dual-line chart taking two-thirds width and a summary card on the right. The chart shows current year vs previous year with solid and dashed lines. The summary card displays totals for both periods and the calculated growth percentage.
Light card surfaces with the current year line using a solid stroke and previous year using a dashed pattern. The legend identifies each line. The summary card stacks three metrics vertically with the growth percentage highlighted in green. A horizontal divider separates the totals from the growth calculation.
This layout is designed for period-over-period analysis where both the trend and totals matter. The dual-line chart shows how performance compares month by month while the summary provides the bottom-line numbers. The growth percentage gives an immediate answer to "how are we doing?" Essential for executive reporting and board presentations.
Totals and growth are calculated automatically from the chart data. The layout stacks on mobile with the chart on top.