Chart Group 15 block design & features
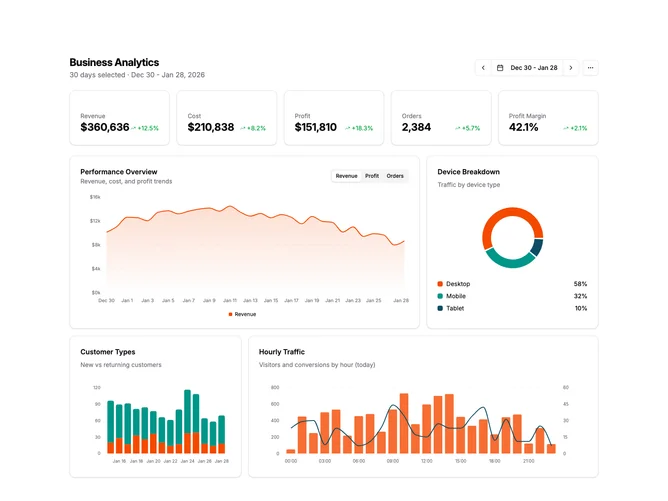
ChartGroup15 is a sophisticated business analytics dashboard with advanced date controls. The header includes a date range picker with navigation arrows to move forward/backward by the selected period, a compare toggle button, and a dropdown menu for export/refresh/settings. The stats row shows key metrics. The bento grid contains a main chart with tabs to switch between revenue, profit, and orders views, plus device breakdown, customer types, and hourly traffic charts.
Light card surfaces with the date picker integrated into a bordered button group with navigation arrows. The main chart uses tabs to switch visualization types. The device breakdown uses a donut chart with center text. Customer types shows a stacked bar chart. Hourly traffic combines bars with a line overlay.
This is a production-ready analytics dashboard with advanced navigation patterns. The arrow buttons shift the date range by the current period length. The main chart tabs allow switching between different metrics without reloading. Multiple chart types demonstrate various visualization options.
The component generates 90 days of sample data plus hourly data for today. Navigation arrows intelligently shift by the selected period. All stats and time-series charts respond to date changes.