Chart Group 13 block design & features
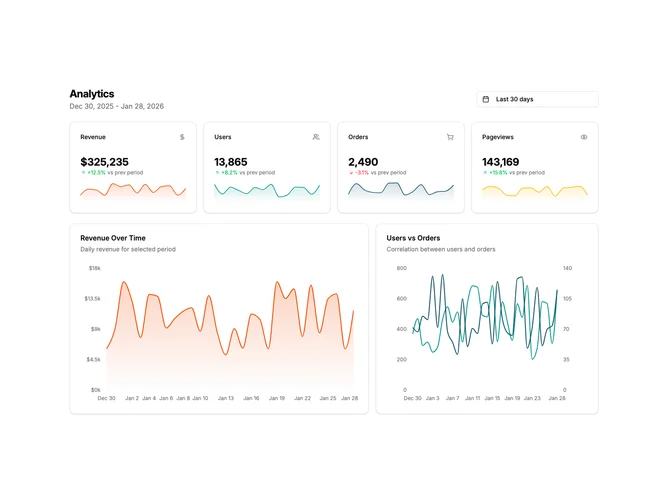
ChartGroup13 is an analytics bento layout with a sophisticated date picker that combines presets with a calendar. The picker has a left sidebar with quick options (Today, Yesterday, Last 7/14/30/90 days) and a dual-month calendar on the right. Four stat cards show key metrics with icons, values, change percentages, and embedded sparklines. Below are two larger charts showing revenue and user/order correlation.
Light card surfaces with the date picker showing the current selection label. The picker popover has preset buttons on the left and a two-month calendar on the right. Stat cards include icons, bold values, colored change indicators, and mini area charts. The bottom row has a 4:3 column ratio with the revenue chart taking more space.
This is a production-ready analytics dashboard with advanced date selection. The preset sidebar provides quick access while the calendar allows custom ranges. Each stat card is self-contained with its own sparkline showing recent trends. The dual-axis line chart shows correlation between metrics. A comprehensive pattern for data-heavy dashboards.
The component generates 90 days of sample data. All stats and charts update when the date range changes. The sparklines in stat cards show the last 14 days regardless of the main selection for quick trend visibility.