Chart Group 12 block design & features
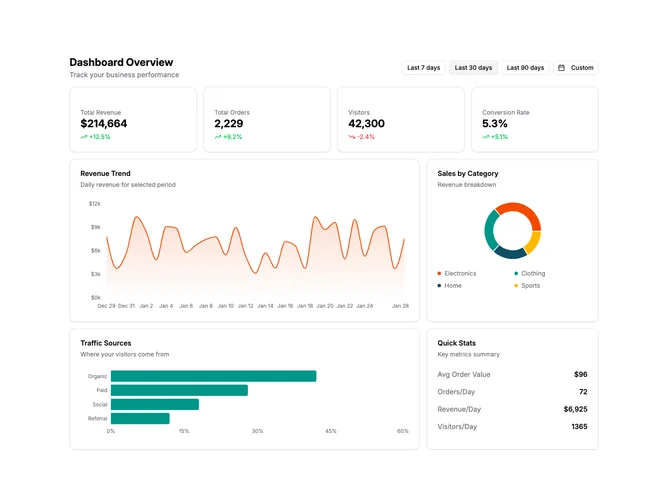
ChartGroup12 is a complete dashboard section with date controls, stats cards, and multiple chart types. The header includes preset buttons for 7, 30, and 90 days plus a custom date range picker. Below are four stat cards showing key metrics. The main content area has a bento-style grid with an area chart, donut chart, bar chart, and quick stats card.
Light card surfaces throughout with the date controls aligned right in the header. Preset buttons highlight when their range is active. The stats row shows values with trend indicators. The chart grid uses varying column spans to create visual hierarchy. All time-series data and calculated stats update when the date range changes.
This is a production-ready dashboard template with full interactivity. The preset buttons provide quick access to common ranges while the calendar allows custom selection. Stats are calculated dynamically from filtered data. The bento layout combines different visualization types effectively. A comprehensive pattern for analytics dashboards.
The component generates 90 days of sample data. The grid is responsive, collapsing gracefully on smaller screens. All charts and stats respond to date range changes in real-time.