Chart Group 11 block design & features
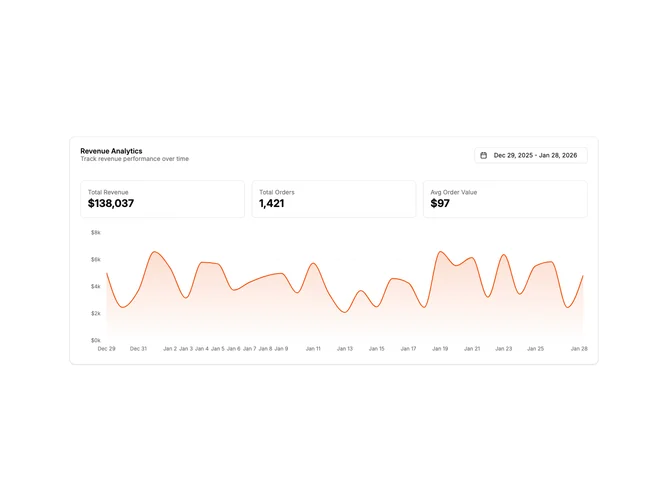
ChartGroup11 is a fully interactive card with a working date range picker. The header contains a dual-month calendar popover that filters the chart data. Summary statistics above the chart update dynamically based on the selected date range. The chart shows revenue data for the selected period.
Light card surface with the date range button showing the current selection. The calendar popover displays two months side by side for easy range selection. Summary stats are displayed in bordered containers above the chart. The chart uses an area visualization with gradient fill. All data filters reactively when the date range changes.
This is a production-ready widget with real interactivity. The date range picker uses the shadcn calendar component in range mode. Data filtering uses date-fns for accurate date comparisons. Summary statistics recalculate on each filter change. A sophisticated pattern for user-controlled time period selection.
The component generates 90 days of sample data and filters it based on selection. The calendar defaults to showing the last 30 days. The X-axis adapts to show appropriate date labels for the selected range.