Chart Card 9 block design & features
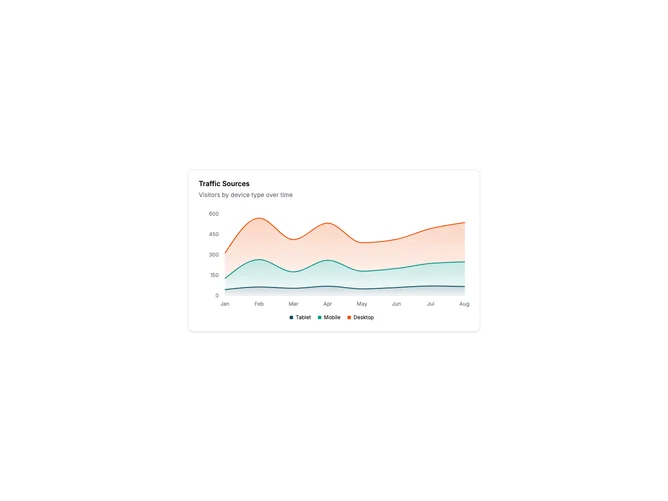
ChartCard9 is a stacked area chart wrapped in a card container. The chart displays three data series layered on top of each other, showing both individual values and total composition over time. A legend at the bottom identifies each series.
Light card surface with gradient fills for each area layer. The areas stack from bottom to top with distinct colors and subtle transparency. Horizontal grid lines provide reference. The legend uses the shadcn chart legend component. Tooltips show all three values when hovering on any point.
Stacked area charts are effective for showing how parts contribute to a whole over time. The layered visualization makes it easy to see both individual trends and total growth. A useful pattern for traffic breakdowns, revenue by product line, or any multi-series composition data.
The chart is responsive and scales with the card width. The stacking order places the largest series at the bottom for visual stability.