Chart Card 27 block design & features
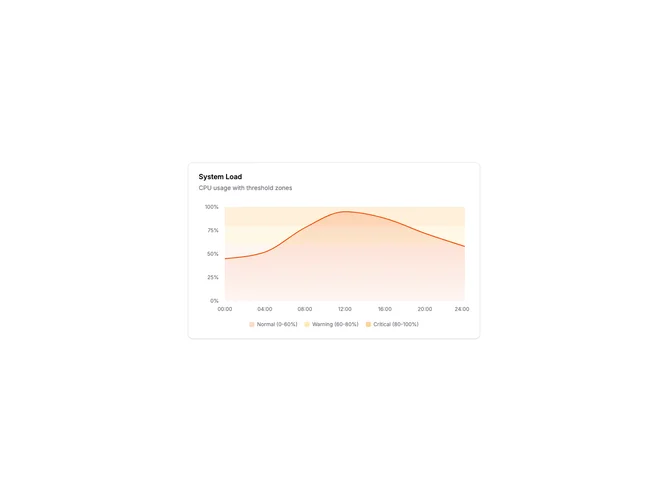
ChartCard27 is an area chart with colored background zones representing different threshold levels. The chart area is divided into three horizontal bands: normal (bottom), warning (middle), and critical (top). The data line moves through these zones, making it clear when values enter concerning ranges.
Light card surface with subtle colored reference areas behind the chart. The zones use low-opacity fills so they don't overwhelm the data. The data area uses a gradient fill with a solid stroke. A legend below the chart explains what each zone represents. The Y-axis shows percentage values from 0 to 100.
Threshold zones provide instant context for whether values are acceptable. This pattern is common in monitoring dashboards for CPU usage, memory, error rates, or any metric with defined acceptable ranges. The colored backgrounds make it immediately obvious when the line enters a warning or critical zone.
The zones are implemented using ReferenceArea components. The opacity is kept low to maintain focus on the actual data while providing context.