Chart Card 24 block design & features
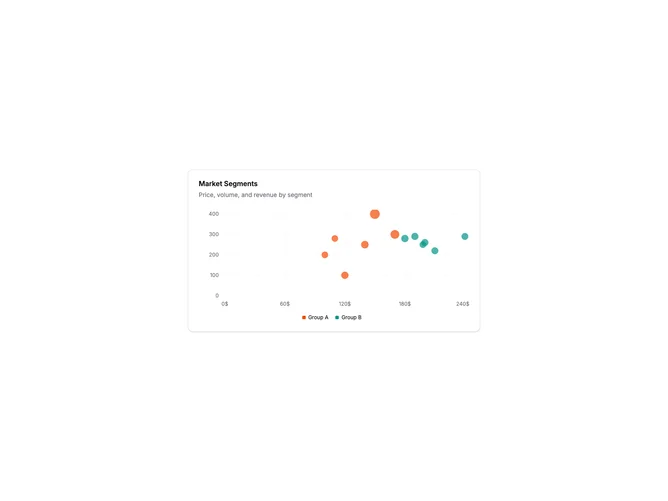
ChartCard24 is a bubble chart extending the scatter plot with a third dimension encoded as bubble size. Two data groups are shown in different colors, each with multiple bubbles positioned by X/Y values and sized by Z value. A legend identifies each group.
Light card surface with semi-transparent bubbles in two colors. Bubble sizes vary based on the Z dimension, with a reasonable range to prevent extreme size differences. Both axes show numeric scales. The legend uses the shadcn chart legend component. Tooltips show all three values (X, Y, Z) when hovering.
Bubble charts add a third quantitative dimension to scatter plots. The size encoding works well for values like revenue, population, or importance. The color grouping enables comparison between categories. This is a data-rich visualization that can communicate complex relationships.
The Z-axis range is constrained to keep bubbles readable. Very large or small bubbles would distort the visualization. The chart handles overlapping bubbles through transparency.