Chart Card 23 block design & features
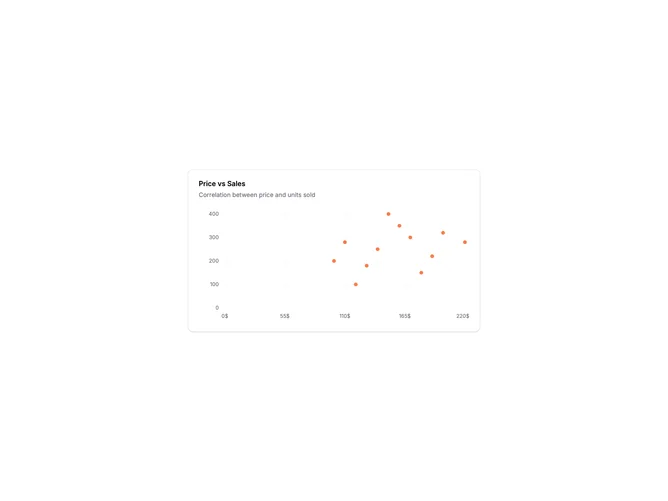
ChartCard23 is a scatter plot showing the relationship between two numeric variables. Each data point is represented as a dot positioned by its X and Y values. The distribution of dots reveals correlation patterns, clusters, or outliers. Grid lines help estimate values.
Light card surface with evenly sized dots using the primary chart color with slight transparency to handle overlapping points. Both axes show numeric scales with clean tick formatting. A dashed grid provides reference without overwhelming the data points. Tooltips show both X and Y values when hovering over any dot.
Scatter plots are the go-to visualization for exploring correlation between variables. They reveal whether variables are positively correlated, negatively correlated, or unrelated. Clusters indicate groupings, outliers stand out visually. Useful for price vs demand, effort vs results, or any two-variable relationship.
The chart handles overlapping points through transparency. The fixed dot size keeps the visualization clean and readable.