Chart Card 22 block design & features
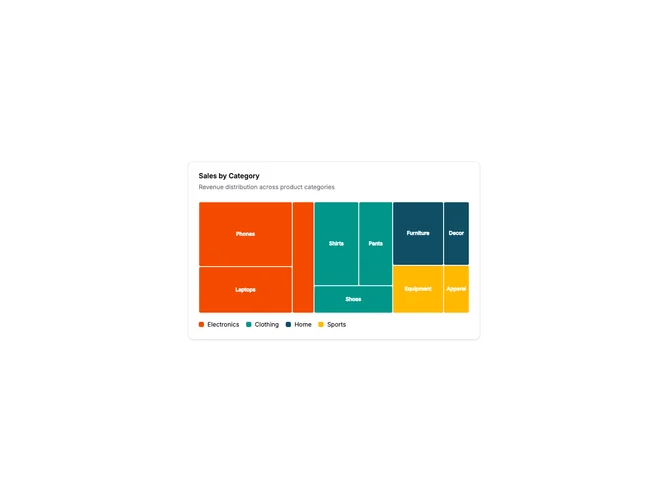
ChartCard22 is a treemap chart displaying hierarchical data as nested rectangles. Each rectangle's size is proportional to its value within the dataset. Categories are color-coded, with subcategories shown as tiles within each color group. Labels appear inside tiles when space permits.
Light card surface with a grid of colored rectangles filling the chart area. Each category uses a distinct color with its subcategories sharing that color. Rectangles have rounded corners and thin borders separating tiles. A legend below the chart identifies each category by color. The treemap algorithm arranges tiles to minimize aspect ratio distortion.
Treemaps are effective for showing part-to-whole relationships in hierarchical data. They make efficient use of space and can display many items simultaneously. The size encoding is immediately intuitive. Common uses include disk space usage, budget breakdowns, or any nested categorical data.
This is a more complex visualization that works best with 10-30 items. Very small tiles may not show labels. The custom content renderer ensures consistent styling.