Chart Card 21 block design & features
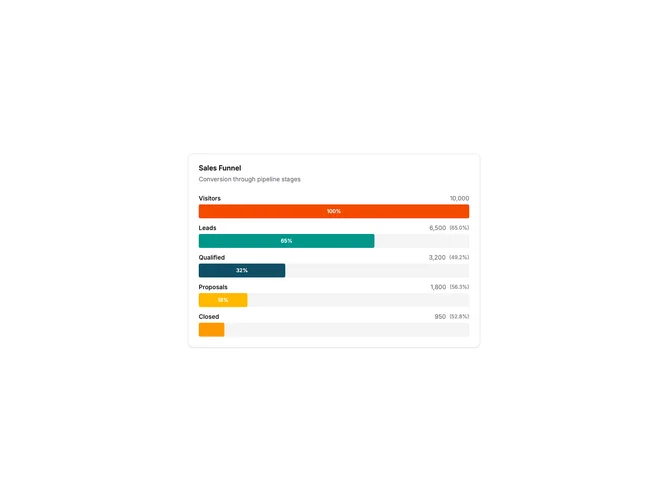
ChartCard21 is a funnel chart showing conversion through sequential stages. Each stage is represented as a horizontal bar with width proportional to its value. Bars decrease in width from top to bottom, creating the characteristic funnel shape. Labels show the stage name, count, and conversion rate from the previous stage.
Light card surface with stacked horizontal bars in distinct colors. Each bar has a muted background track showing the full potential width. The bar fills show actual values with percentage labels inside when space permits. Text labels appear above each bar with stage name on the left and values on the right. Conversion percentages show drop-off between stages.
Funnel charts are essential for visualizing conversion pipelines, sales processes, or any sequential flow where volume decreases at each step. The visual narrowing immediately communicates where the biggest drop-offs occur. This custom implementation provides more control than recharts funnel components.
The component accepts an array of stage data for flexibility. Colors can be customized per stage. The bars animate smoothly when values change.