Chart Card 20 block design & features
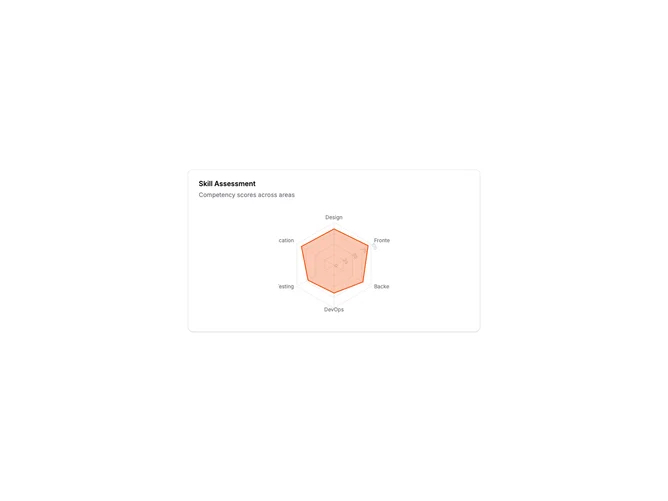
ChartCard20 is a radar chart displaying multiple attributes as vertices of a polygon. Each axis represents a different dimension with values plotted from center to edge. The filled polygon shape shows the overall profile at a glance. Labels around the perimeter identify each dimension.
Light card surface with a polygonal grid providing reference lines. The data polygon uses a semi-transparent fill with a solid stroke outline. Axis labels are positioned outside the chart at each vertex. The chart is centered within the card with square aspect ratio. Tooltips show exact values when hovering.
Radar charts excel at comparing multiple attributes of a single entity. They reveal strengths and weaknesses across dimensions simultaneously. Common uses include skill assessments, product comparisons, or performance reviews. The shape of the polygon immediately communicates the overall profile.
The chart handles 5-8 dimensions well. Fewer dimensions make the shape less meaningful, more dimensions become hard to read. The centered layout ensures all labels are visible.