Chart Card 17 block design & features
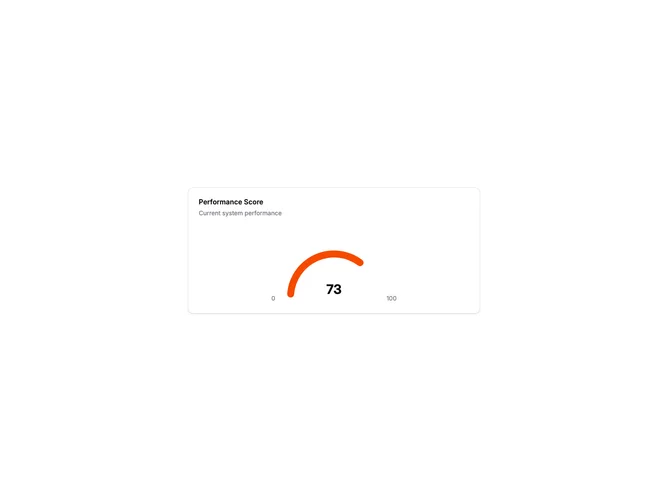
ChartCard17 is a semi-circle gauge chart with a needle pointing to the current value. The arc is divided into colored zones representing different performance levels. Tick marks along the arc provide reference points. The current value displays below the gauge with min/max labels at the ends.
Light card surface with a custom SVG gauge. The arc shows three color zones: red for low/poor, yellow for medium/warning, and green for high/good. A triangular needle rotates to point at the current value. Small tick marks at 0, 25, 50, 75, and 100 percent positions provide scale reference. The needle has a circular pivot point at the center.
Gauge charts evoke speedometers and physical instruments, making them intuitive for performance scores, health metrics, or system status. The colored zones provide instant context about whether the value is good, concerning, or critical. This is a more elaborate visualization than a simple progress bar.
The gauge is built with pure SVG for flexibility and crisp rendering at any size. The needle position is calculated from the value prop.