Chart Card 15 block design & features
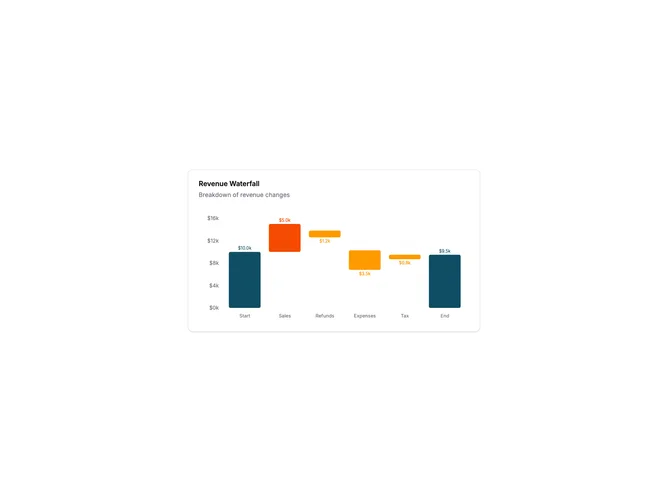
ChartCard15 is a waterfall chart showing how a starting value transforms through a series of changes to reach a final total. Each bar floats at the appropriate level, with increases extending upward and decreases extending downward. Start and end totals are shown as full bars from zero.
Light card surface with three distinct colors: one for totals (start/end), one for increases, and one for decreases. The floating bars connect visually to show the running total. Value labels appear above each bar showing the change amount. Horizontal grid lines help track the running total level.
Waterfall charts excel at explaining how you got from point A to point B. They break down complex changes into understandable steps. Common uses include revenue bridges, budget variance analysis, or any breakdown showing contributing factors to a final result.
This is a more complex chart type that requires careful data transformation. The visual clearly communicates the story of cumulative changes.