Chart Group 10 block design & features
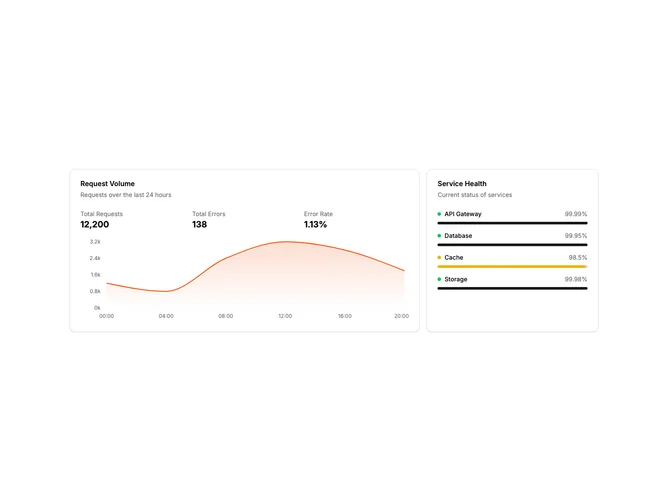
ChartGroup10 is an infrastructure monitoring view with a request volume chart and service health panel. The main card shows request volume over 24 hours with summary stats for total requests, errors, and error rate. The side panel lists services with status indicators and uptime percentages.
Light card surfaces with the chart using a gradient area fill. Summary stats are displayed in a three-column grid above the chart. The service health panel shows colored status dots, service names, uptime percentages, and thin progress bars. Green indicates healthy services while yellow indicates degraded status.
This layout is designed for DevOps and infrastructure monitoring. The request volume chart shows traffic patterns while the service health panel provides quick status checks. The error rate calculation surfaces potential issues. A practical pattern for status pages and monitoring views.
The layout uses a 2:1 column ratio on desktop. The service health panel stacks below the chart on mobile. Progress bar colors change based on service status.